Conflict Escalation and Market Impact Scenarios
Unlock More Features
Login to access AI-powered analysis, deep research reports and more advanced features
About us: Ginlix AI is the AI Investment Copilot powered by real data, bridging advanced AI with professional financial databases to provide verifiable, truth-based answers. Please use the chat box below to ask any financial question.
Related Stocks
Based on current market data and recent developments, prolonged Russia-Ukraine conflict escalation could significantly influence energy markets and defense sector valuations through multiple channels. This analysis synthesizes recent geopolitical events, market pricing, and sector performance data[0][1][2][3][4][5].
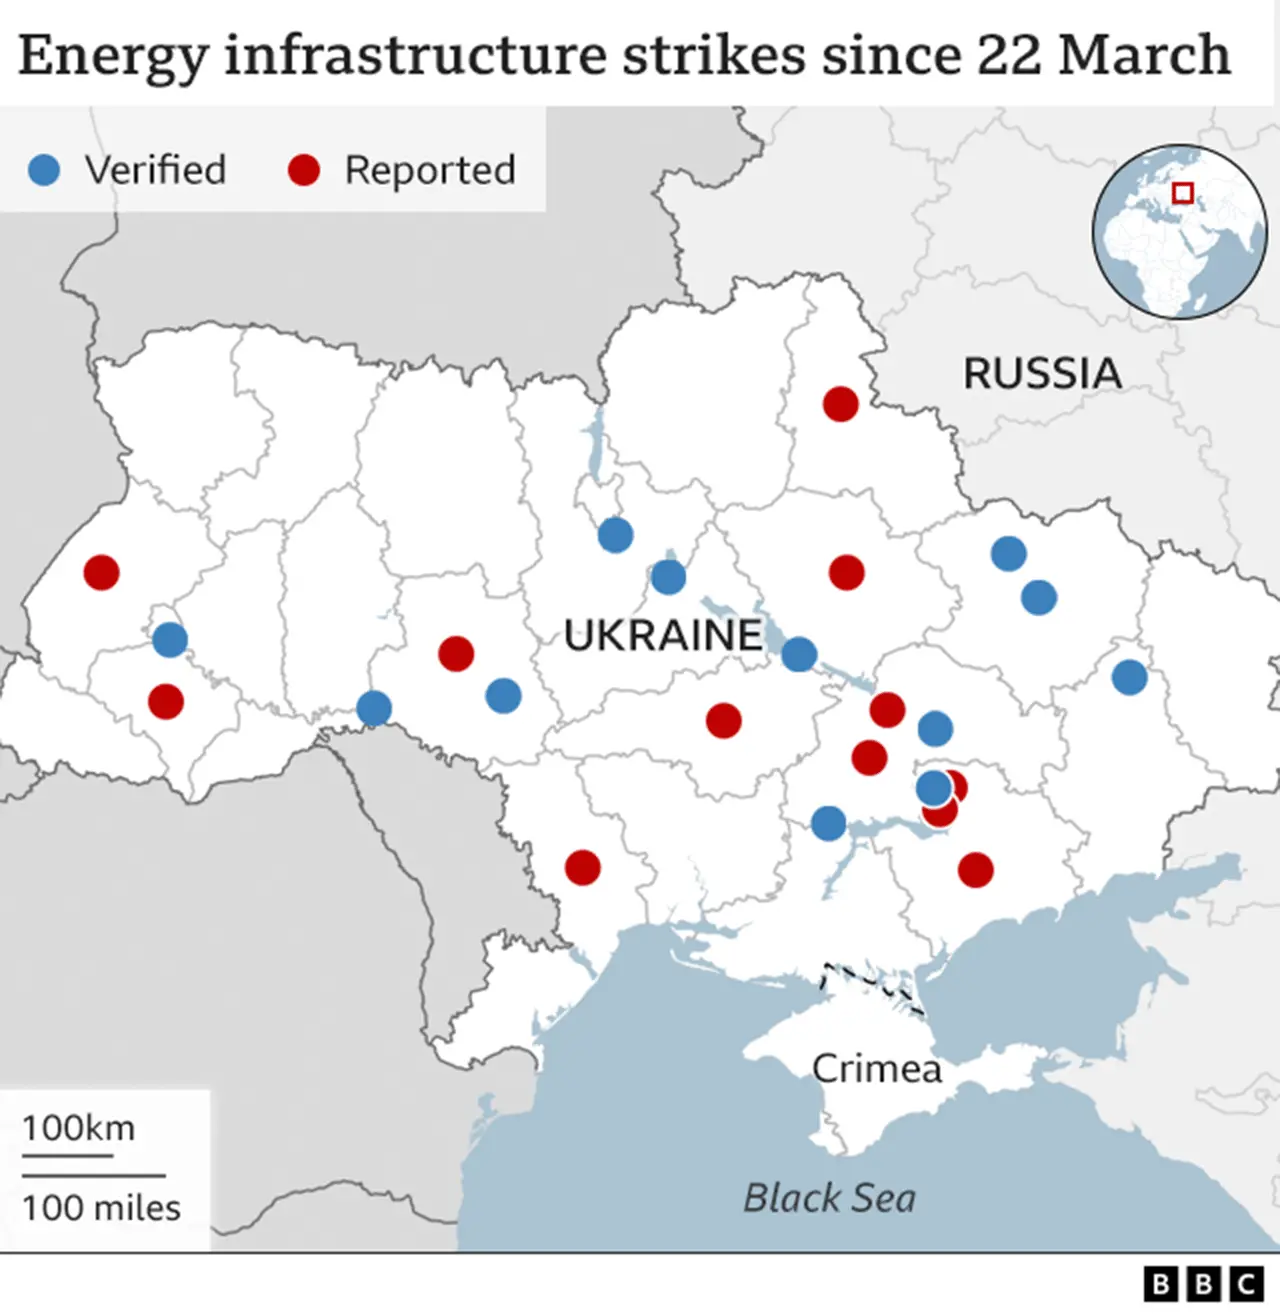
Recent reports indicate increased intensity in drone warfare and missile strikes. Russian forces have launched large-scale drone attacks targeting Ukrainian transport and critical infrastructure, with reported strikes on energy and rail infrastructure and drone attacks on Kyiv causing casualties ahead of diplomatic meetings[1][2][3]. The Russian Ministry of Defense reported downing 111 Ukrainian drones in a three-hour period (per user-provided context), underscoring the expanding scale of drone warfare.
- Energy sector is down 0.41405% today[0], reflecting short-term market sentiment amid holiday-affected trading.
- Key energy ETF pricing:
- XLE (Energy Select Sector SPDR): $44.20, P/E 17.38[0]
- XOP (Oil & Gas Exploration & Production): $124.96, P/E 12.74[0]
- XLE: Period change +4.69%; 52-week range $37.24–$47.41[0]
- XOP: Period change -9.36%; 52-week range $99.01–$146.56[0]
- Supply risk:Escalation could increase supply disruptions risk, supporting price volatility. Historical patterns include sharp moves when infrastructure attacks occurred.
- Sanctions ripple:Continued or expanded sanctions may tighten supply for sanctioned entities, potentially shifting market dynamics. A recent report highlighted business impacts on certain fuel retailers due to sanctions[6].
- Demand changes:Sustained conflict can affect European demand and substitution toward alternative sources.
- Lockheed Martin (LMT): $483.03, P/E 26.88[0]; 2024–2025 period change +6.32%[0]
- RTX: $185.17, P/E 38.02[0]
- Northrop Grumman (NOC): $577.37, P/E 20.79[0]
- General Dynamics (GD): $342.20, P/E 22.16[0]
- LMT: Period high $618.95; period low $410.11; 52-week range $410.11–$516.00[0]
- Sector trend shows elevated defense spending patterns, with historical gains around earlier escalations.
- Replenishment demand:Higher ammunition and equipment consumption creates sustained orders.
- Allied support:NATO and allied commitments increase procurement.
- Technology emphasis:Drones, missile defense, and electronic warfare priorities could favor companies with relevant capabilities.
- Backlog visibility:Major contractors’ multi-year contracts provide earnings visibility.
- Energy:Elevated volatility with periodic spikes on news of infrastructure attacks or supply constraints. XLE/XOP could see price swings near recent volatility levels (historical daily std. dev: XLE 1.35%, XOP 1.76%[0]).
- Defense:Modest upside aligned with budgetary execution and backlog conversion. Multiples near current levels absent major program shifts.
- Energy:Sustained price elevation if infrastructure is repeatedly targeted or sanctions tighten further. Historical patterns suggest sharp upside moves, but duration can be limited by demand adjustments and alternative supplies.
- Defense:15–25% earnings growth potential via higher orders and accelerated procurement. Valuation multiples could compress modestly on strong fundamentals, yielding total returns primarily driven by earnings. High P/E names (e.g., RTX at 38.02[0]) offer room for multiple rerating if delivery risk declines.
- Energy:Mean reversion toward pre-conflict pricing dynamics as risk premia fade.
- Defense:Valuation pressure from lower-than-expected procurement growth; backlogs may shrink relative to elevated expectations.
- Infrastructure attack frequency and scale (e.g., energy and rail targeting)[1][2][3]
- Sanctions policy changes (e.g., measures affecting Russian energy entities)[6]
- NATO and allied defense budget allocations and procurement timelines
- OPEC+ production decisions and inventory levels
- U.S. and European defense appropriations and program authorizations
- Energy:Favor high-quality, diversified names; commodity exposure and geopolitical risk can produce outsized moves but require active risk management.
- Defense:Emphasize backlog depth and program diversification; monitor execution on delivery and cost overruns. Historical data show LMT’s significant price range during past escalations (period high $618.95 vs. low $410.11)[0].
- [0] 金灵API数据
- [1] Institute for the Study of War - Russian Offensive Campaign Assessment (Dec 22, 2025), https://understandingwar.org/research/russia-ukraine/russian-offensive-campaign-assessment-december-22-2025/
- [2] New York Post - “Russian drones, missiles pound Ukraine before Zelensky’s meeting with Trump” (Dec 27, 2025), https://nypost.com/2025/12/27/world-news/russian-drones-missiles-pound-ukraine-before-zelenskys-meeting-with-trump/
- [3] Times of Israel - “Russia attacks Kyiv with missiles and drones, wounding 11 ahead of Ukraine-US meeting” (Dec 27, 2025), https://www.timesofisrael.com/liveblog_entry/russia-attacks-kyiv-with-missiles-and-drones-wounding-11-ahead-of-ukraine-us-meeting/
- [4] Bloomberg - “US Lukoil Gas Station Owners Left in Limbo Over Russia Sanctions” (Dec 27, 2025), https://www.bloomberg.com/news/articles/2025-12-27/us-lukoil-gas-station-owners-left-in-limbo-over-russia-sanctions
- [5] TechCrunch - “The 7 top space and defense tech startups from Disrupt Startup Battlefield” (Dec 27, 2025), https://techcrunch.com/2025/12/27/the-7-top-space-and-defense-tech-startups-from-disrupt-startup-battlefield/
- [6] U.S. Department of Defense - Acquisition Transformation Strategy (Nov 10, 2025), https://media.defense.gov/2025/Nov/10/2003819441/-1/-1/1/ACQUISITION-TRANSFORMATION-STRATEGY.PDF
Insights are generated using AI models and historical data for informational purposes only. They do not constitute investment advice or recommendations. Past performance is not indicative of future results.
About us: Ginlix AI is the AI Investment Copilot powered by real data, bridging advanced AI with professional financial databases to provide verifiable, truth-based answers. Please use the chat box below to ask any financial question.