Analysis of Stabilization Signals on the Technical Side of Imeik (300896.SZ)
Unlock More Features
Login to access AI-powered analysis, deep research reports and more advanced features
About us: Ginlix AI is the AI Investment Copilot powered by real data, bridging advanced AI with professional financial databases to provide verifiable, truth-based answers. Please use the chat box below to ask any financial question.
Related Stocks
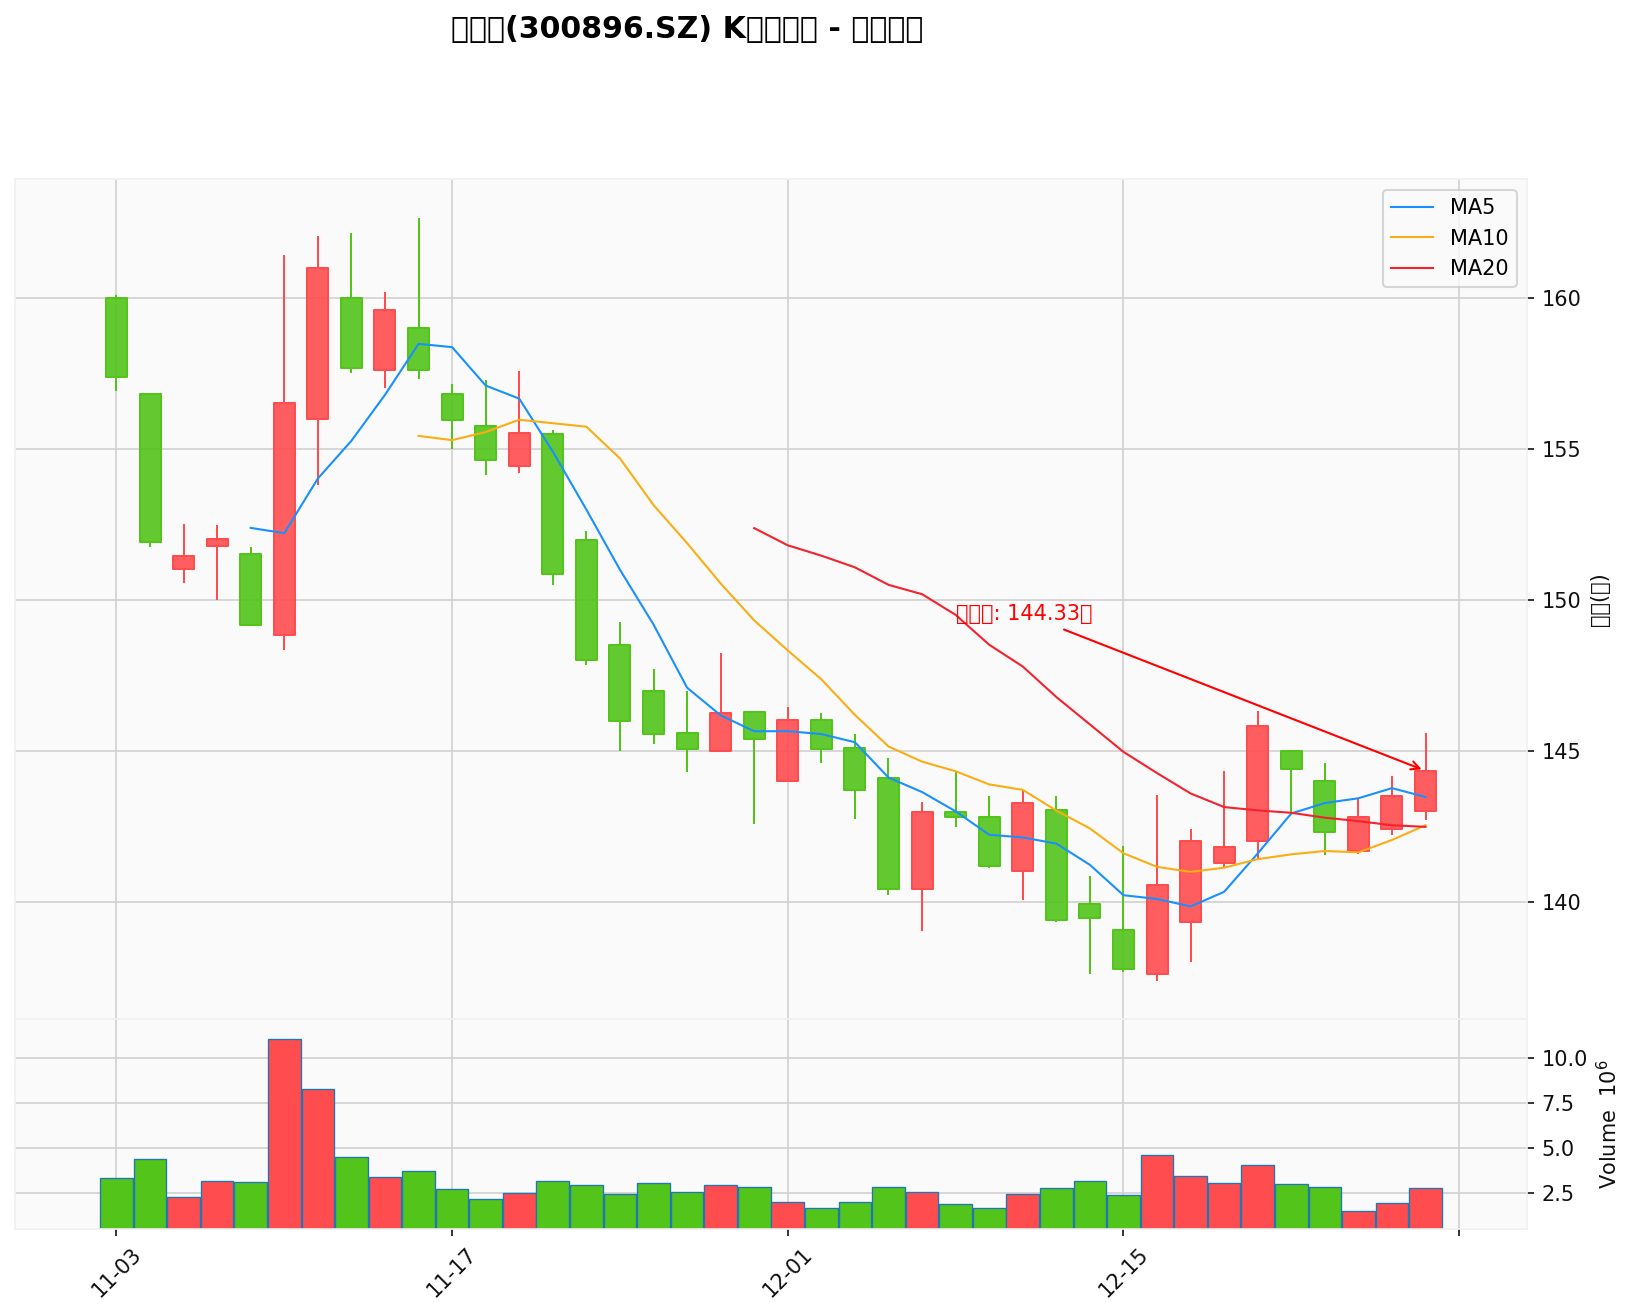
Based on the latest technical analysis data, Imeik’s stock price closed at
| Moving Average | Price (yuan) | Signal Significance |
|---|---|---|
| 5-day MA | 143.46 | ✅ Price stands above, forming short-term support |
| 10-day MA | 142.53 | ✅5-day MA golden cross 10-day MA |
| 20-day MA | 142.48 | ✅Price stands above, mid-term stabilization signs |
| 60-day MA | ~150.84 | ⚠️Mid-term still needs consolidation to form a bottom |
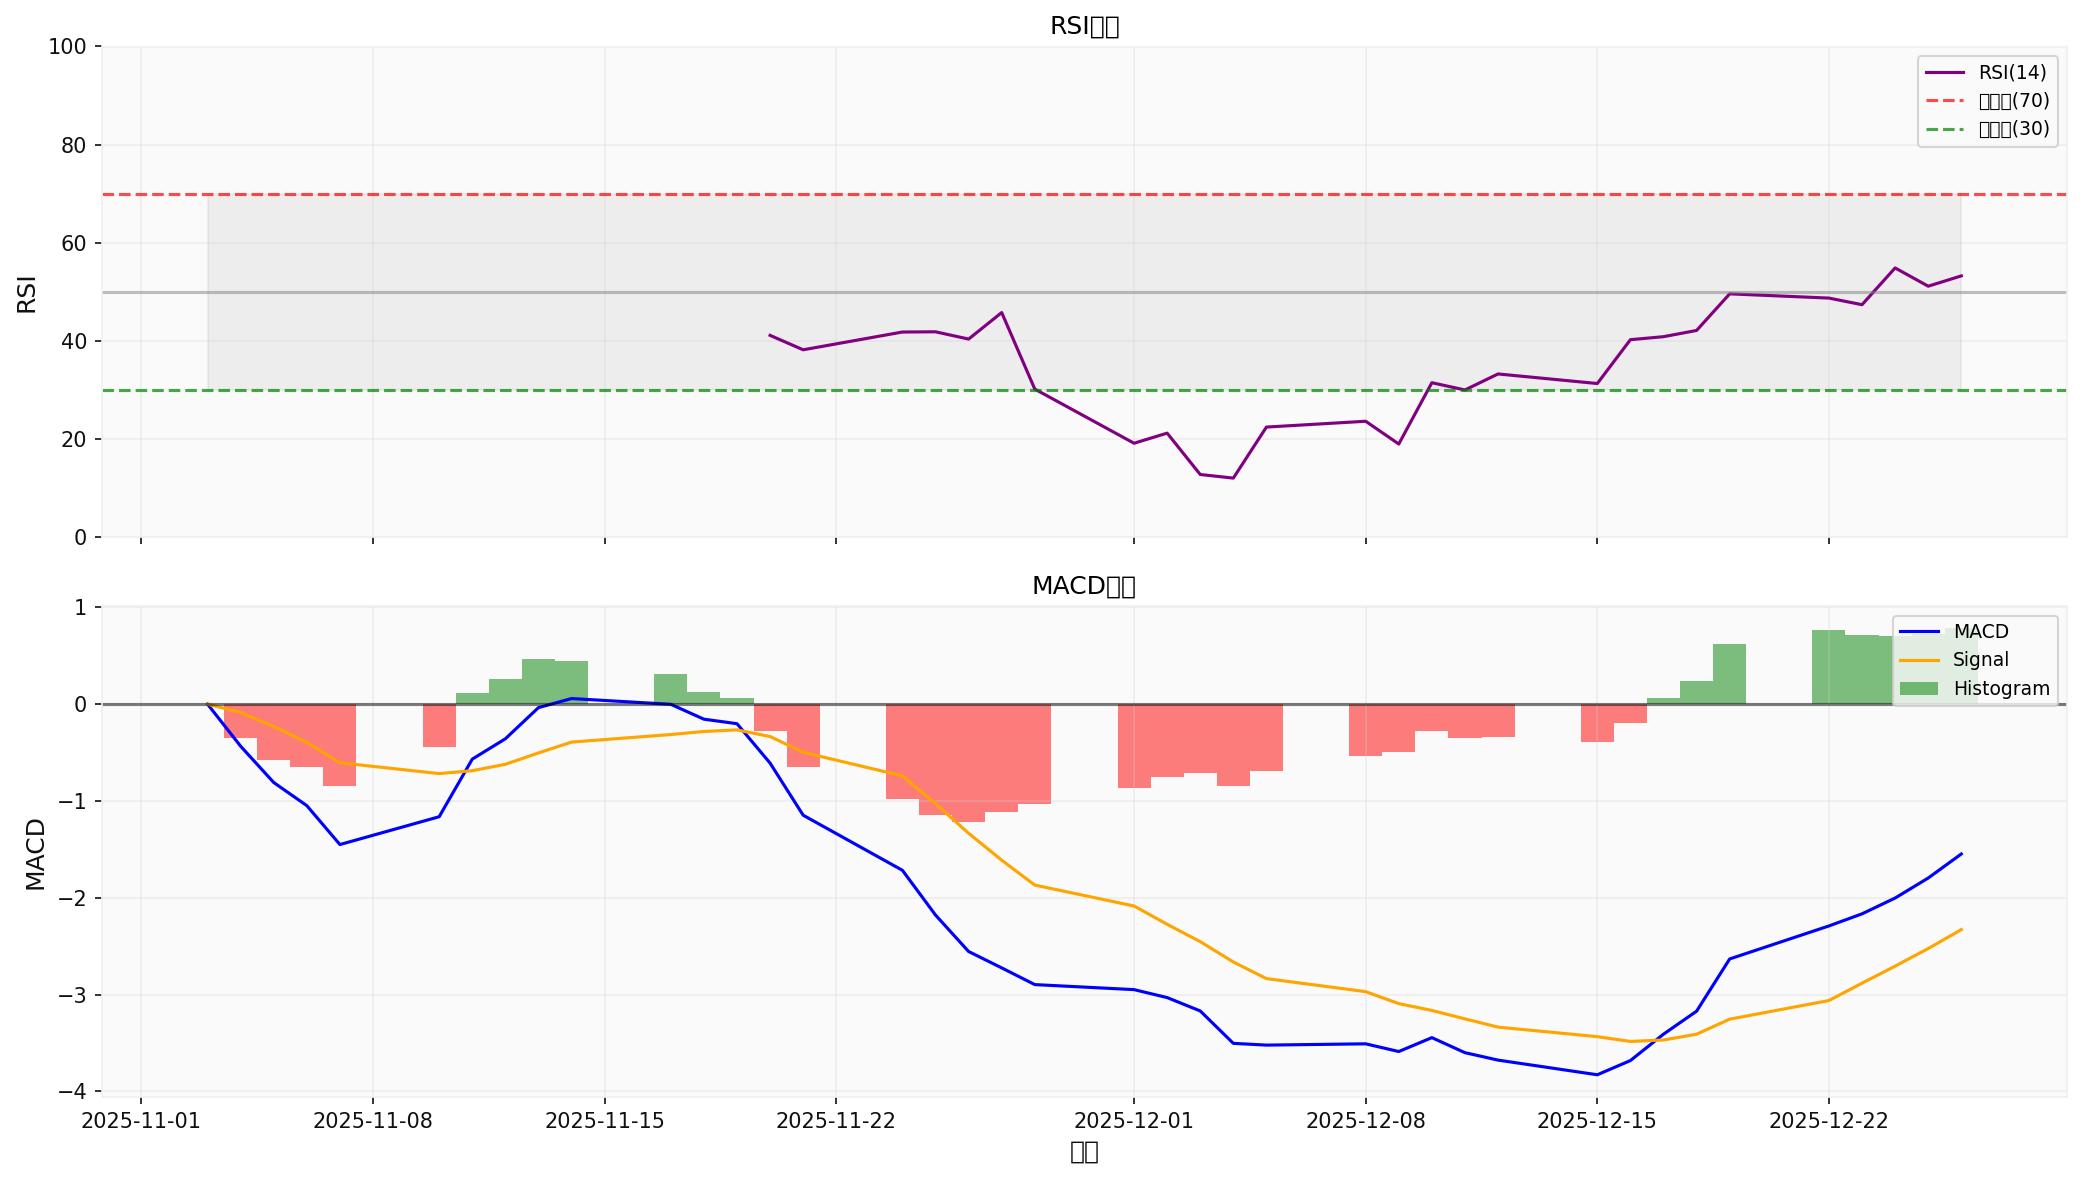
####2. RSI Indicator in Safe Range
- RSI(14) =53.27, which is in the normal range of 40-60, with neither overbought risk nor oversold pressure, and market sentiment is relatively balanced [0].
####3. MACD Indicator Shows Bullish Pattern
- MACD line (-2.14) is above the Signal line (-3.18), forming a “bullish golden cross” pattern
- The histogram is positive (+1.04), indicating upward momentum is accumulating [0]
####4. KDJ Indicator is Bullish but Need to Watch for Overbought
- K value (69.23) > D value (63.54), in the bullish zone
- J value (80.63) is close to the overbought zone (80), short-term adjustment may be needed [0]
####5. Bollinger Bands Show Relatively Strong Price
- Bollinger Bands middle track (142.48 yuan) forms support
- Current price is above the middle track of Bollinger Bands, with relatively strong trend
- Reference fluctuation range: [138.08 yuan,146.87 yuan]
####1. Medium and Long-Term Trend Still Weak
- Moving average bearish排列:20-day MA is below the 60-day MA, mid-term still in bearish trend [0]
- Long-term moving average pressure:Current stock price is below the 200-day MA, long-term trend is weak
- High-level correction pressure:Down about 31% from the 52-week high (209 yuan), there is a large amount of locked-up shares above
####2. Fundamental Pressure
- Revenues of core products ‘Haiti’ (solution category) and ‘Rubilante Angel’ (gel category) decreased by 23.79% and 23.99% respectively [1]
- Competition in the medical beauty industry is intensifying, first-mover advantages are being quickly diluted
| Indicator Category | Stabilization Signals | Risk Signals |
|---|---|---|
| Moving Average System | 3 | 2 |
| MACD | 2 | 0 |
| KDJ | 2 | 1 |
| Bollinger Bands | 1 | 0 |
| Total | 8 | 3 |
- Support level:138-142 yuan range
- Resistance level:146-150 yuan range
- Operation Strategy:Consider building positions in batches below 140 yuan, stop-loss level set around 135 yuan
- Position Control:Control within 30%, add positions after breaking through 150 yuan
[0] Jinling AI - Imeik (300896.SZ) Technical Analysis Data (2025-12-27)
[1] East Money Network - “When Imeik Becomes a ‘Laodeng Stock’” (https://caifuhao.eastmoney.com/news/20251226111605688421820)
Insights are generated using AI models and historical data for informational purposes only. They do not constitute investment advice or recommendations. Past performance is not indicative of future results.
About us: Ginlix AI is the AI Investment Copilot powered by real data, bridging advanced AI with professional financial databases to provide verifiable, truth-based answers. Please use the chat box below to ask any financial question.