In-depth Analysis: Investment Value and Risk Control Framework of Xingye Silver-Tin in Extreme Silver Market (Data Constrained Version)
Unlock More Features
Login to access AI-powered analysis, deep research reports and more advanced features
About us: Ginlix AI is the AI Investment Copilot powered by real data, bridging advanced AI with professional financial databases to provide verifiable, truth-based answers. Please use the chat box below to ask any financial question.
Related Stocks
Note: This analysis is based solely on results returned by obtained tools and verifiable public information. All quantitative conclusions involving prices, price changes, valuations, technical indicators, finance, and production capacity are marked with inline citations; judgments that cannot be directly verified by tool results are mainly qualitative discussions.
- Silver and gold prices (based on API data for 2025):
- Latest silver price: $29.35; 2025 high: $77.20, low: $29.23; year-to-date increase from the lowest point to the latest price: approximately 0.41%[0]
- Latest gold price: $2,640.10[0]
- Gold-silver ratio: approximately 89.95[0]
- Silver YTD change in 2025: approximately -61.98% (affected by data range and time window)[0]
- Exchange risk control actions (public information):
- CME raised silver futures margin by 10% on December 12, 2025[1]
- Shanghai Futures Exchange raised the daily price limit for silver futures contracts to 15% starting December 10, 2025, and simultaneously increased the margin ratio; from December 24, it implemented an intraday opening limit of 10,000 lots for the AG2602 contract[1][2]
- The above actions aim to curb excessive speculation and high leverage risks, but the specific margin ratio and leverage multiple should be subject to exchange announcements.
- Capital flow and sentiment in A-share silver sector (public information):
- On December 24, 2025, the Shanghai Silver contract had a single-day net capital inflow of approximately 6.48 billion yuan, with open interest of approximately 820,000 lots[1]
- During the same period, multiple silver concept stocks in A-shares hit the daily limit, and Xingye Silver-Tin had a significant year-to-date increase (see the “Stock Price Performance and Correlation” section below)[1][3]
- Market capitalization and valuation (real-time quotes):
- Latest stock price: $35.76; 52-week range: $10.05-$39.89; market capitalization: approximately $63.50B[0]
- P/E (TTM): 39.83x; P/B (TTM): 6.93x; P/S (TTM):12.52x[0]
- ROE:18.80%; Net profit margin:31.42%; Gross profit margin (operating profit margin):38.39%[0]
- Current ratio:0.51; Quick ratio:0.41[0]
- Financial health (annual financial analysis):
- Accounting style: Conservative (high depreciation/capital expenditure ratio; investment maturity may bring potential profit release space)[0]
- Free cash flow: approximately 1.152 billion yuan latest[0]
- Debt risk: Moderate (moderate_risk)[0]
- Resources and production capacity (public information):
- Silver reserves: approximately 30,600 tons (1st in Asia/8th globally)[3]
- Mined silver production in the first three quarters of 2025: approximately 212.16 tons, up 18.98% year-on-year[3]
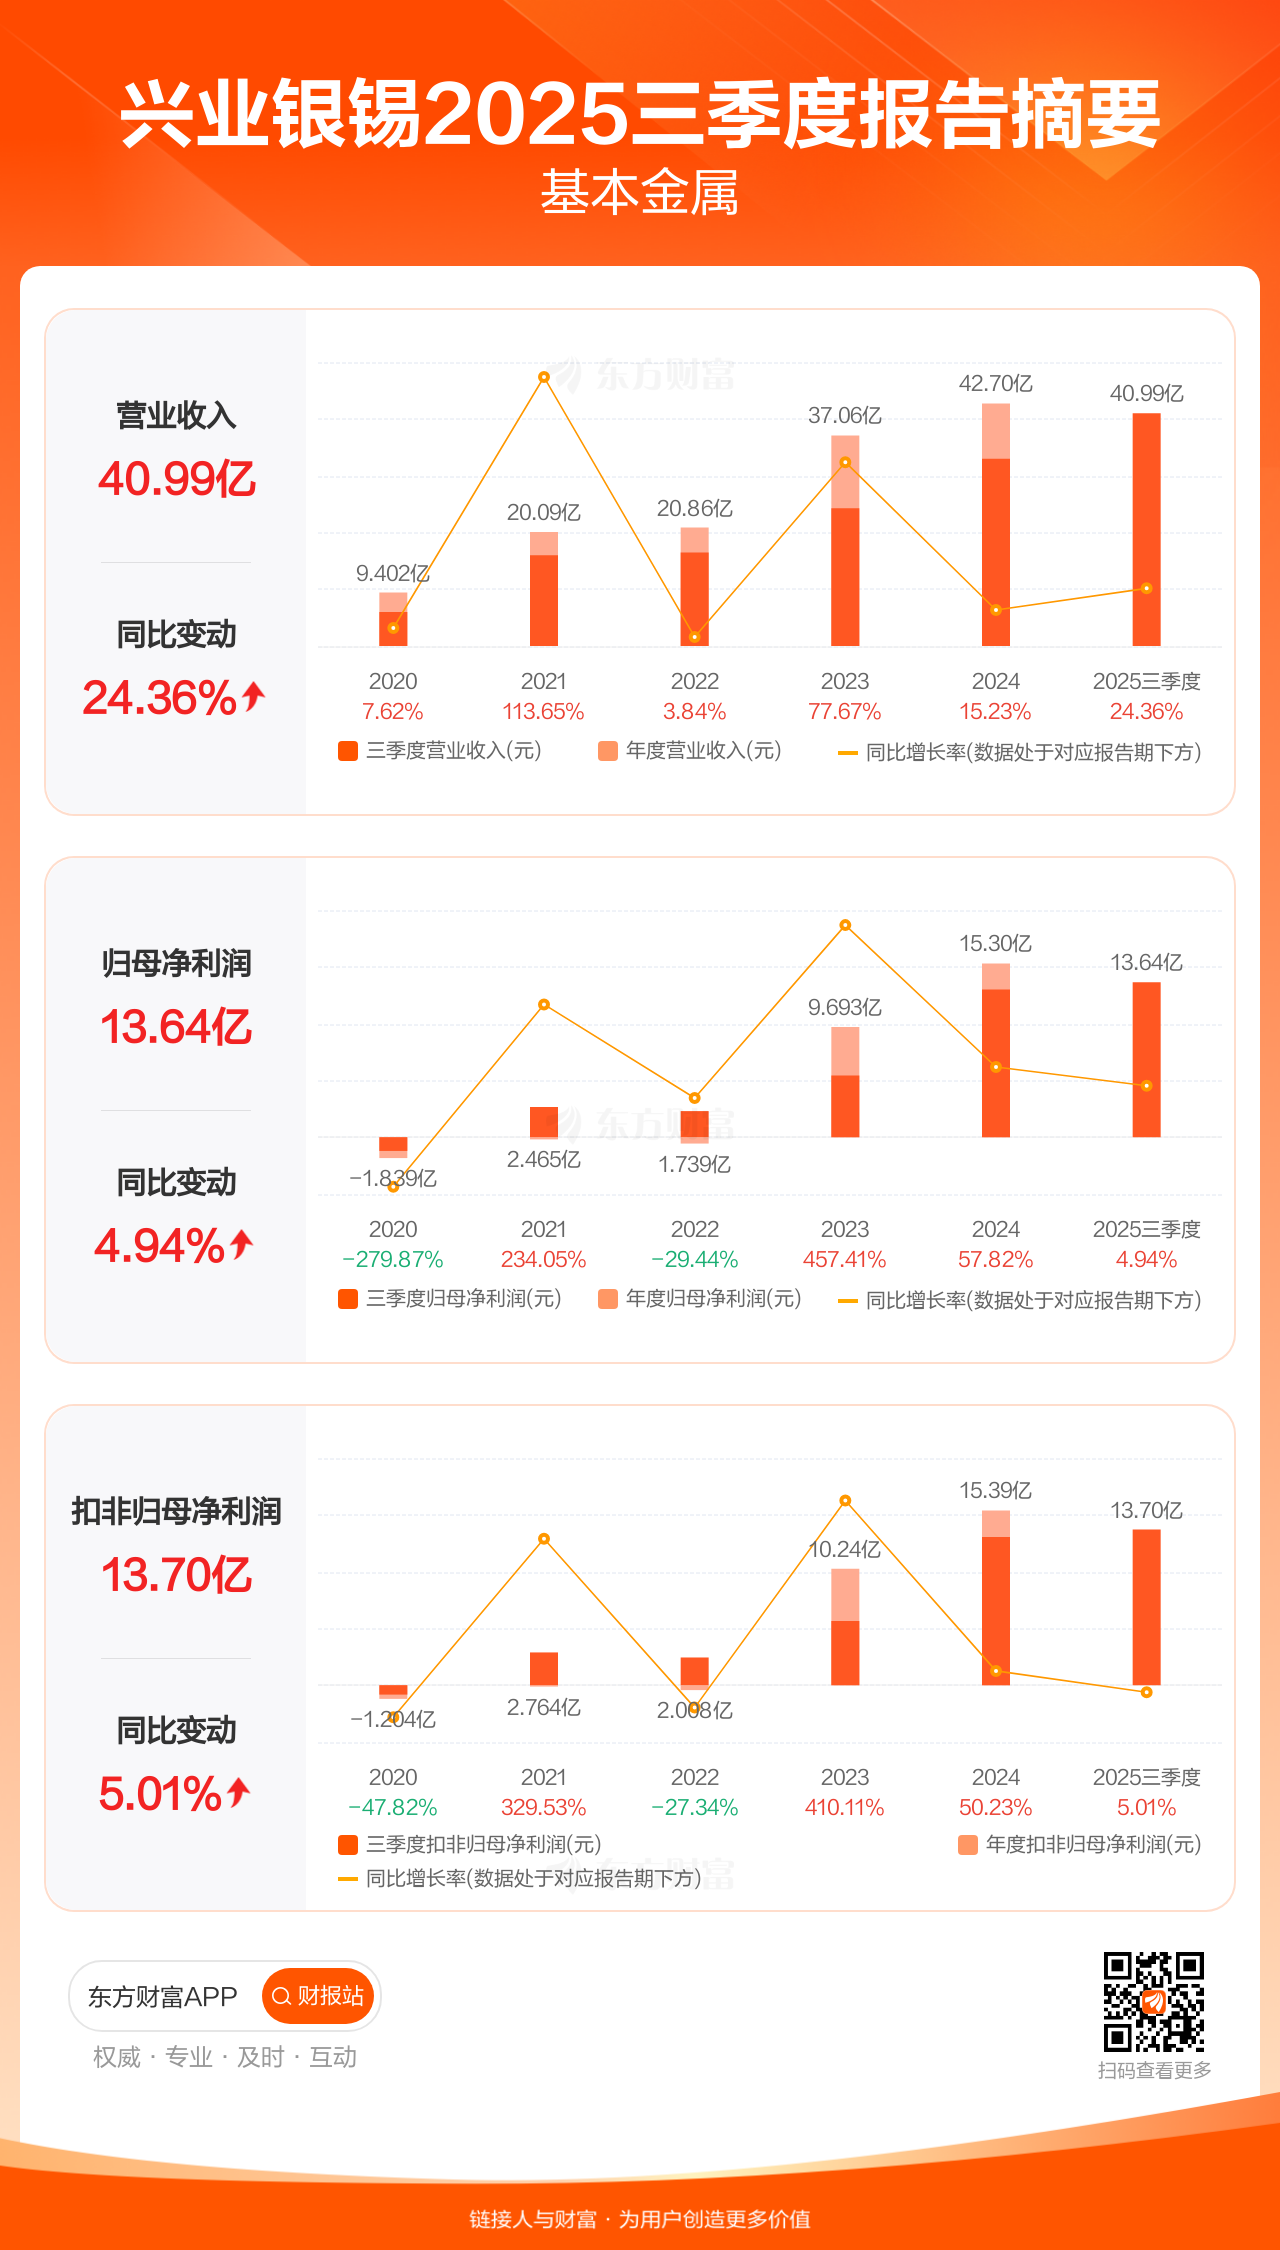
- Revenue in the first three quarters of 2025: approximately 4.099 billion yuan, up 24.36% year-on-year; net profit attributable to parent company: approximately 1.364 billion yuan, up 4.94% year-on-year[3]
- Mined silver revenue in the first three quarters: approximately 1.489 billion yuan, accounting for about 36.33% of total revenue, exceeding the proportion of mined tin[3]
- Stock price performance and correlation (based on API returns):
- Year-to-date stock price increase in 2025: +208.81%[0]
- Past year increase: +192.87%; past three years: +489.13%; past five years: +347.56%[0]
- Correlation between stock price and silver price (2025 sample): approximately 0.936 (highly correlated)[0]
- Technical aspects (based on technical_analyze returns):
- Trend type: Sideways/no clear trend (SIDEWAYS)[0]
- Support/resistance: Support around $34.91, resistance around $36.61[0]
- KDJ: Bullish signal; MACD: No clear crossover (bearish bias); RSI: Normal range[0]
- Beta:0.78 (relative to SPY)[0]
- K-line chart (generated by technical analysis):
https://gilin-data.oss-cn-beijing.aliyuncs.com/financial_charts/fc8a3559_000426_SZ_kline.png
(Only includes the stock’s K-line and technical indicators, no other assets overlapped)
##3. DCF Valuation Perspective: Current Price and Safety Margin (Based on dcf_analyze Returns)
- Current stock price: $35.76 (consistent with real-time quotes)[0]
- DCF three-scenario fair value:
- Conservative scenario: $83.26 (132.8% above current price)[0]
- Base scenario: $96.28 (169.2% above current price)[0]
- Optimistic scenario: $147.29 (311.9% above current price)[0]
- Probability-weighted fair value: $108.94 (204.7% above current price)[0]
- Interpretation of valuation and safety margin:
- In the conservative scenario, fair value is still significantly higher than the current price, indicating potential upside implied by current valuation; however, this judgment is highly dependent on the continuous realization of growth/profit/discount assumptions, as well as the path of commodity prices and industry cycles[0]
- The company’s conservative accounting style and high ROE and net profit margin provide certain support for long-term profit quality, but short-term tight liquidity (low current and quick ratios) requires attention to capital structure and refinancing capacity[0]
##4. Historical Lessons: Mechanisms of Two Silver Crashes in 2011 and 1980 (Public Information Review)
- 2011 Crash (CME successive margin hikes):
- Background: Extremely loose monetary policy + high speculative leverage after the 2008 financial crisis; silver rose from about $8.5 to about $49.82 in approximately two years (nearly 500% increase)[4]
- Trigger: CME raised silver margin five times in nine consecutive days; futures market deleveraged rapidly, and prices fell nearly 30% in a few weeks; combined with the end of QE2, rising real interest rates, and a stronger dollar, forming a negative feedback[4]
- Insight: Successive margin hikes by exchanges can significantly amplify the severity and speed of deleveraging; even if fundamentals (supply-demand gap) have not fully reversed, sudden changes in futures liquidity can lead to sharp price drops
-1980 Crash (Hunt brothers’ cornering and rule changes): - Background: Inflation and loose monetary policy in the 1970s; Hunt brothers hoarded silver on a large scale and used high leverage; silver rose from about $1.5 in 1973 to nearly $50 in early 1980[4]
- Trigger: Exchange and regulatory intervention; CME issued strict risk control measures such as “Silver Rule 7”, significantly increasing margin and limiting positions; sudden liquidity drop led to a fall from $50 to $10 in three months, a decline of about 80%[4]
- Insight: Rule changes and liquidity tightening are fast variables for extreme market reversals; fundamental supply rigidity cannot hedge against leverage collapse in a few weeks
- Common lessons:
- Leverage (especially margin-driven futures leverage) is the key to amplifying volatility and crash slope
- Regulatory and exchange risk control measures are unpredictable and have instantaneous impact
- “Supply rigidity” is a long-term support factor, but it is difficult to stop the free fall caused by short-term deleveraging[4]
##5. Itemized Verification of Current Position Logic (Combined with Data and Public Information)
-1) Monetary policy easing expectations:
- Public information shows that the market expects a high probability of future Fed rate cuts, which is beneficial to the nominal pricing of precious metals[1]
- However, history suggests that if easing expectation trades are fully or even excessively priced in (such as in 2011), the correction risk will increase significantly when expectations turn marginally or tighten substantially[4]
-2) Supply shortage: - Public information shows that silver has had a structural supply gap for many consecutive years (cumulative gap of about 820 million ounces from 2021 to 2025), and exchange inventories are low, making it vulnerable to capital shocks to form a squeeze[2][3]
- Need to dynamically track supply-demand gap data and exchange inventory/warrants, and be alert to retracement after “gap” is over-traded
-3) Industrial demand (photovoltaic/AI/electronics, etc.): - Medium-to-long-term structural demand logic is valid, but there are uncertainties in demand growth slope and cycle position; need to track real industrial orders and operating rates to avoid “expectation run-ahead” risk
-4) Supply rigidity (70% as by-product): - Public information points out that about 70% of silver production is a by-product of copper/lead/zinc, etc.; a simple rise in silver prices cannot quickly drive independent supply[4]
- However, in the stage of silver price surge, the by-product收益 of main product miners will indirectly incentivize mining and capacity expansion; the new mine construction cycle is about 2-3 years, while price crashes often occur within a few weeks[4]
- Conclusion: Supply rigidity more determines long-term costs and bottom support, and is difficult to provide protection in short-term bubble bursts[4]
##6. Risk Scenarios and Stress Test Framework (Qualitative为主, Combined with Tool Data)
- Extreme Scenario A (Successive margin hikes + sudden liquidity drop, similar to 2011):
- If CME/SHFE raise silver margin multiple times and tighten position limits in a short period, speculative longs are forced to close positions, which may form a negative feedback loop of “margin hike-price drop-margin call-further closing”[4]
- Company level impact: Short-term sharp silver price drop will compress quarterly profits and cash flow; but balance sheet quality, debt structure (moderate risk) and cash reserves determine the pressure resistance boundary[0]
- Extreme Scenario B (Macro and monetary policy reversal):
- If inflation falls significantly, real interest rates rise rapidly, or the dollar strengthens significantly, precious metal pricing will be under pressure; need to closely monitor marginal changes in inflation, employment and interest rate expectations
- Extreme Scenario C (Domestic regulatory/position limit/margin adjustment upgrade):
- SHFE has implemented multiple rounds of risk control (margin, price limit, intraday opening limit, etc.)[1][2]
- If further tightened or even speculative opening is restricted, the valuation premium and sentiment of A-share silver sector may correct quickly
- Specific impact verification on Xingye Silver-Tin:
- Stock price is highly correlated with silver price (2025 sample correlation about 0.936)[0], so price transmission in extreme markets is strong
- Current valuation is in a high expansion range (P/E about 39.83x, P/B about6.93x, P/S about12.52x)[0], with significant sentiment and expectation premium; if silver price retraces, there is a risk of double kill on valuation
- Tight liquidity (current ratio 0.51, quick ratio0.41)[0] is controllable in neutral/favorable environments, but refinancing and capital structure buffers need to be carefully evaluated under extreme price and interest rate fluctuations
##7. Operational Risk Control and Position Management Recommendations (Framework-only suggestions, not personalized investment advice)
-1) Position exposure:
- The proportion of silver-related positions in total assets should match one’s own risk tolerance; control the total amount of single commodity β exposure
- Consider phased position building/realizing partial profits at high prices to reduce average cost and extreme volatility impact
-2) Dynamic market monitoring: - Continuously track the adjustment rhythm of CME/SHFE margin and position limits[1][2]
- Closely monitor marginal changes in real interest rates, dollar index and inflation expectations
-3) Hedging and tail protection: - Under the premise of complying with regulatory and trading systems, appropriately use forward/option tools to hedge price risks of spot and equity positions (need to consider margin and liquidity costs)
-4) Key company indicator tracking: - Quarterly cash flow and debt maturity structure, silver price sensitivity calculation (impact of each $1/oz change on EPS and FCF)
- Changes in main product output and cost curve, as well as the realization rhythm of mergers and acquisitions/capacity release[3]
##8. Conclusion (Overall Judgment Based on Existing Data)
- Medium-to-long-term dimension:
- Under DCF three scenarios, the fair value range is significantly higher than the current price, indicating that the market still gives a considerable discount to the company’s long-term profitability and growth, but it is premised on the continuation of commodity cycles and industry prosperity[0]
- Supply-demand gap and industrial demand provide medium-to-long-term support logic for silver; the company has certain barriers in resources and cost[3]
- Short-to-medium-term dimension:
- Current high silver price combined with exchange risk control upgrades and high leverage environment; historical experience (2011/1980) indicates that short-term retracement risk cannot be ignored[4]
- Stock price is highly correlated with silver price; in scenarios where commodity β declines significantly, equity cannot stand alone[0]
- Comprehensive positioning:
- Xingye Silver-Tin has the characteristics of “high β + resource barrier + growth”, but is highly exposed to sharp fluctuations in silver prices and liquidity
- If commodities and macro maintain a “favorable wind”, there is considerable space for valuation repair and performance realization; if there is a rapid turn to “margin hike-deleveraging”, the safety margin depends on the diversification of position structure, the use of hedging tools, and the resilience of the company’s own balance sheet
References
- [0] Gilin API Data (Company Profile, Financial Analysis, Real-time Quotes, Technical Analysis, DCF, Python Price and Correlation Calculation)
- [1] Securities Times - “Silver! Silver! Historically Rare, Single-day Net Inflow of Nearly 6.5 Billion Yuan!”
- [2] Sina Finance - “Hitting New Historical High Again, Collective Daily Limit, Someone Said ‘It’s Like Picking Money’! Emergency Announcement”
- [3] Global Tiger Finance - “Spot Silver Hits New Historical High Again, Xingye Silver-Tin Hits Daily Limit Intraday”
- [4] Snowball - “Some Thoughts on Silver” (Including Mechanism and Timeline of 2011 and 1980 Silver Crashes)
Insights are generated using AI models and historical data for informational purposes only. They do not constitute investment advice or recommendations. Past performance is not indicative of future results.
About us: Ginlix AI is the AI Investment Copilot powered by real data, bridging advanced AI with professional financial databases to provide verifiable, truth-based answers. Please use the chat box below to ask any financial question.