S&P 500 Market Concentration Analysis: Historic Risk Levels and Mega-Cap Dominance
Unlock More Features
Login to access AI-powered analysis, deep research reports and more advanced features
About us: Ginlix AI is the AI Investment Copilot powered by real data, bridging advanced AI with professional financial databases to provide verifiable, truth-based answers. Please use the chat box below to ask any financial question.
Related Stocks
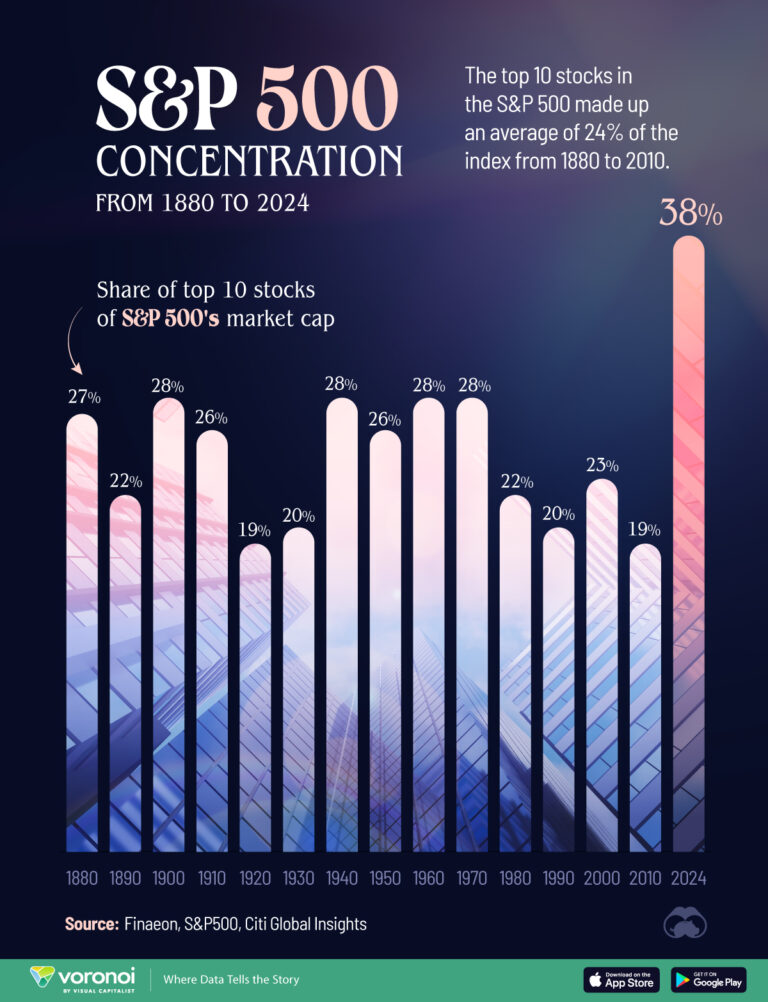
This analysis is based on the Seeking Alpha report [1] published on November 7, 2025, highlighting concerning levels of market concentration in the S&P 500. The data reveals that market concentration has reached historic highs in 2025, creating significant structural risks for investors [1].
Current market data shows extreme concentration levels:
- Top 10 holdingscontrol approximately 32-42% of the S&P 500’s total market capitalization [2][3]
- NVIDIA (NVDA)represents ~8% of the entire S&P 500, marking the largest single-stock weighting in decades [2]
- Mega-cap dominance: Microsoft and Apple each exceed 7% weight, with these three firms controlling nearly 25% of the index [2]
- Combined market value: Top 10 companies hold nearly $19 trillion out of a $45 trillion total S&P 500 market cap [2]
The concentration is particularly pronounced in the technology sector, where official classifications significantly understate true exposure. While the official IT sector represents 36.1% of the S&P 500 [4], including tech-adjacent stocks like Amazon, Google, Meta, and Tesla pushes technology-related allocation beyond 51% [1].
Recent market performance demonstrates the concentration effects clearly:
- S&P 500 performance: +4.14% over the past 60 days [0]
- NASDAQ outperformance: +6.49% over the same period, reflecting tech dominance [0]
- Contribution analysis: Top 3 stocks (NVIDIA, Microsoft, Apple) delivered nearly half of the S&P 500’s gains in 2025 [2]
Individual stock analysis reveals the scale of these mega-cap companies:
Several fundamental factors are driving this concentration:
- AI-driven growth: Eight of the 10 largest stocks are directly tied to artificial intelligence buildout [3]
- Winner-takes-all dynamics: Digital platforms and network effects create natural monopolies
- Passive investing acceleration: Index fund growth has amplified concentration by buying market-cap weighted indices
The official sector classifications create a false sense of diversification. Investors believing they have balanced exposure across sectors are actually heavily concentrated in technology-related businesses, creating vulnerability to sector-specific shocks.
Current concentration levels have surpassed previous peaks, including the dot-com era. The top 10 holdings’ 42% concentration represents a new record in market history [2], suggesting the current environment may carry unprecedented systemic risk.
- Valuation risk: Top holdings trade at elevated P/E ratios, with NVIDIA at 53.58x [0]
- Idiosyncratic risk: Single stock events could trigger cascading effects across the entire market
- Regulatory risk: Increased antitrust scrutiny of mega-cap technology companies
- Liquidity mismatch: Passive fund flows may exacerbate volatility during market stress
Historical patterns suggest that increased concentration typically leads to higher volatility [2], making the current structure particularly concerning for market stability.
Decision-makers should closely track:
- Quarterly earnings: Any disappointments from top 10 holdings could trigger outsized market reactions
- Regulatory developments: Antitrust actions or technology regulations
- Interest rate environment: Higher rates disproportionately impact high-growth tech valuations
- Geopolitical tensions: Technology sector exposure to international trade conflicts
Rather than abandoning S&P 500 exposure entirely, the analysis suggests considering new money allocation to funds with better diversification properties [1]. This approach acknowledges the recent outperformance of concentrated holdings while managing long-term structural risk.
The S&P 500’s current structure represents an unprecedented level of market concentration, with the top 10 holdings controlling 32-42% of the index and technology-related exposure exceeding 50% when including adjacent sectors. This creates asymmetric risk where a few mega-cap stocks drive performance while exposing investors to significant idiosyncratic and systemic risks.
The concentration is driven by AI-related growth, winner-takes-all market dynamics, and the rise of passive investing. Current valuation levels, regulatory scrutiny, and historical patterns all suggest elevated risk profiles. Investors should monitor earnings reports, regulatory developments, and interest rate changes closely, while considering diversification strategies that reduce exposure to this concentration risk.
The market’s current trajectory suggests that while concentration has driven recent outperformance, it also creates vulnerability to sharp corrections if any of the mega-cap holdings experience significant setbacks or regulatory challenges.
Insights are generated using AI models and historical data for informational purposes only. They do not constitute investment advice or recommendations. Past performance is not indicative of future results.
About us: Ginlix AI is the AI Investment Copilot powered by real data, bridging advanced AI with professional financial databases to provide verifiable, truth-based answers. Please use the chat box below to ask any financial question.